Dominica Coral Analytics
Empowering Coral Conservation: transforming data into impactful visual storytelling

Context:
Nature Island Dive is a Scuba Diving centre located in Soufriere, Dominica, a Caribbean island also known as the Nature Island.
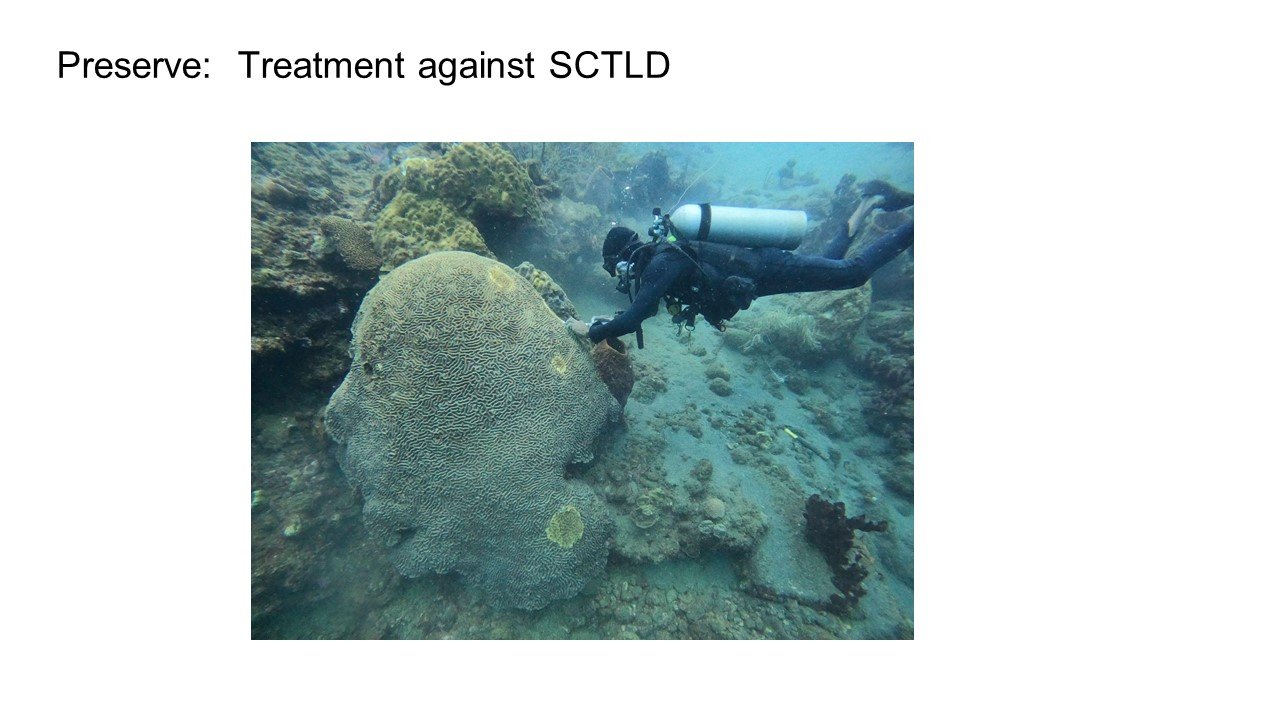
Similar to many other reefs around the world, the corals in Dominica are suffering from Stony Coral Tissue Loss Disease (SCTLD) and Bleaching, which are killing corals at an alarming rate.
Led by the dive shop owner Simon Walsh (who would be proudly addressed as a “Coral Daddy”), and in collaboration with a Dominica-based NGO Oceans Forward, there is a team with staff and volunteers at the dive shop that dedicates effort to monitoring, protecting and preserving corals, ensuring they continue as part of the region’s vital marine habitat.
Interventions to conserve and restore corals including treating diseased corals with antibiotics, setting up coral trees as nurseries in the ocean, setting up shields to prevent bleaching, and setting up temperature controlled tanks to preserve diversity of coral genotypes during peak summer season.


Data Challenges:
As with any other under-funded programs, the coral conservation runs with limited resources, with no expert data personnel or specialised tools for data management, visualisation or analytics.
There was abundant data but very limited data analysis and storytelling. All the data collected from the field was sitting in various google sheets, files and tabs, and even in notebooks. Existing data was very scattered, not consistently formatted or managed, and difficult to consume. Some of the data was stored as colours in the spreadsheets rather than actual values. Typos, inconsistencies and missing data can be found throughout.
Lack of specialised data tools and personnel
Limited budget
Scattered and inconsistent data
Missed opportunity for data storytelling
All the knowledge stored in people’s brains and not in shareable data
“We have all this data that we are not using - this is the hard evidence that we need to communicate what we have achieved, to help inform donors and volunteers, to help write grant applications, and even to influence policies.”
- The coral team
Project:
We launched a Coral Analytics project with the below objectives, covering the scope of the coral trees (which had the most comprehensive historical data):
Build robust data collection processes and data foundation
Enable visual data storytelling to communicate key achievements and progress
Ability to perform deep dive analysis when needed
These are the critical foundation and low-hanging fruits that we have identified for the first (Phase I) analytics project, given the status and progress of the coral conservation work.
Deliverables:
The project was completed with the following deliverables:
A data model designed for the analytical objectives, with built-in automated validations
A new data collection process designed to add minimal friction, tested by the team
An interactive dashboard showing the summary of project achievements and progress
A cleaned and consolidated dataset ready for deep dive analysis when needed
In addition, the coral team has learned about:
The magic of analytical thinking and data storytelling
Low cost data management best practices
Different types of dashboard for different purposes
Impact:
The analytics project has completely changed how the coral team views, interacts and thinks about data.
It has not only given them a more visual portal to get up-to-date summary statistics of the project's progress, and communicate such progress effectively, but also motivated them to dedicate time and care to data collection, as they see the powerful stories it will allow them to tell down the road.
The Coral Team, in front of the new Coral Rescue Centre building
The foundation created in this project paved the way for future analytics work too. Hypotheses validation, time series analysis, correlation analysis, predictive analysis, forecasting, and other more advanced analytics techniques becomes more accessible with a well-maintained data foundation.
Simon has gone from “the last person interested in data” to a true data champion, stewarding the team towards a more methodical, robust, and data-driven future of ocean conservation.
“After years of studiously and not very enthusiastically entering data into boring sheets, we have now totally changed out attitude. The visual output in Tableau has become one of our best visual tools and has raised our profile immensely. Now when we pull up the interactive dashboard and review our project with potential grant funders and other coral practitioners, we see their level of understanding and respect multiplied. We have noticed that they want to roll over our statistics to see if our results confirm their own hypothesis.”
- Simon Walsh
Gallery

Dominica Coral Rescue Center - Coral Rescue Overview

Interactivity - click on trees to filter and view photo

Interactivity - hover over overall survival rate to see survival rates by species

Interactivity - hover over overall growth rate to see growth per species.png

Interactivity - hover over species to see survival and reason for death per species

Demo dashboard - detailed growth analysis